Greensync
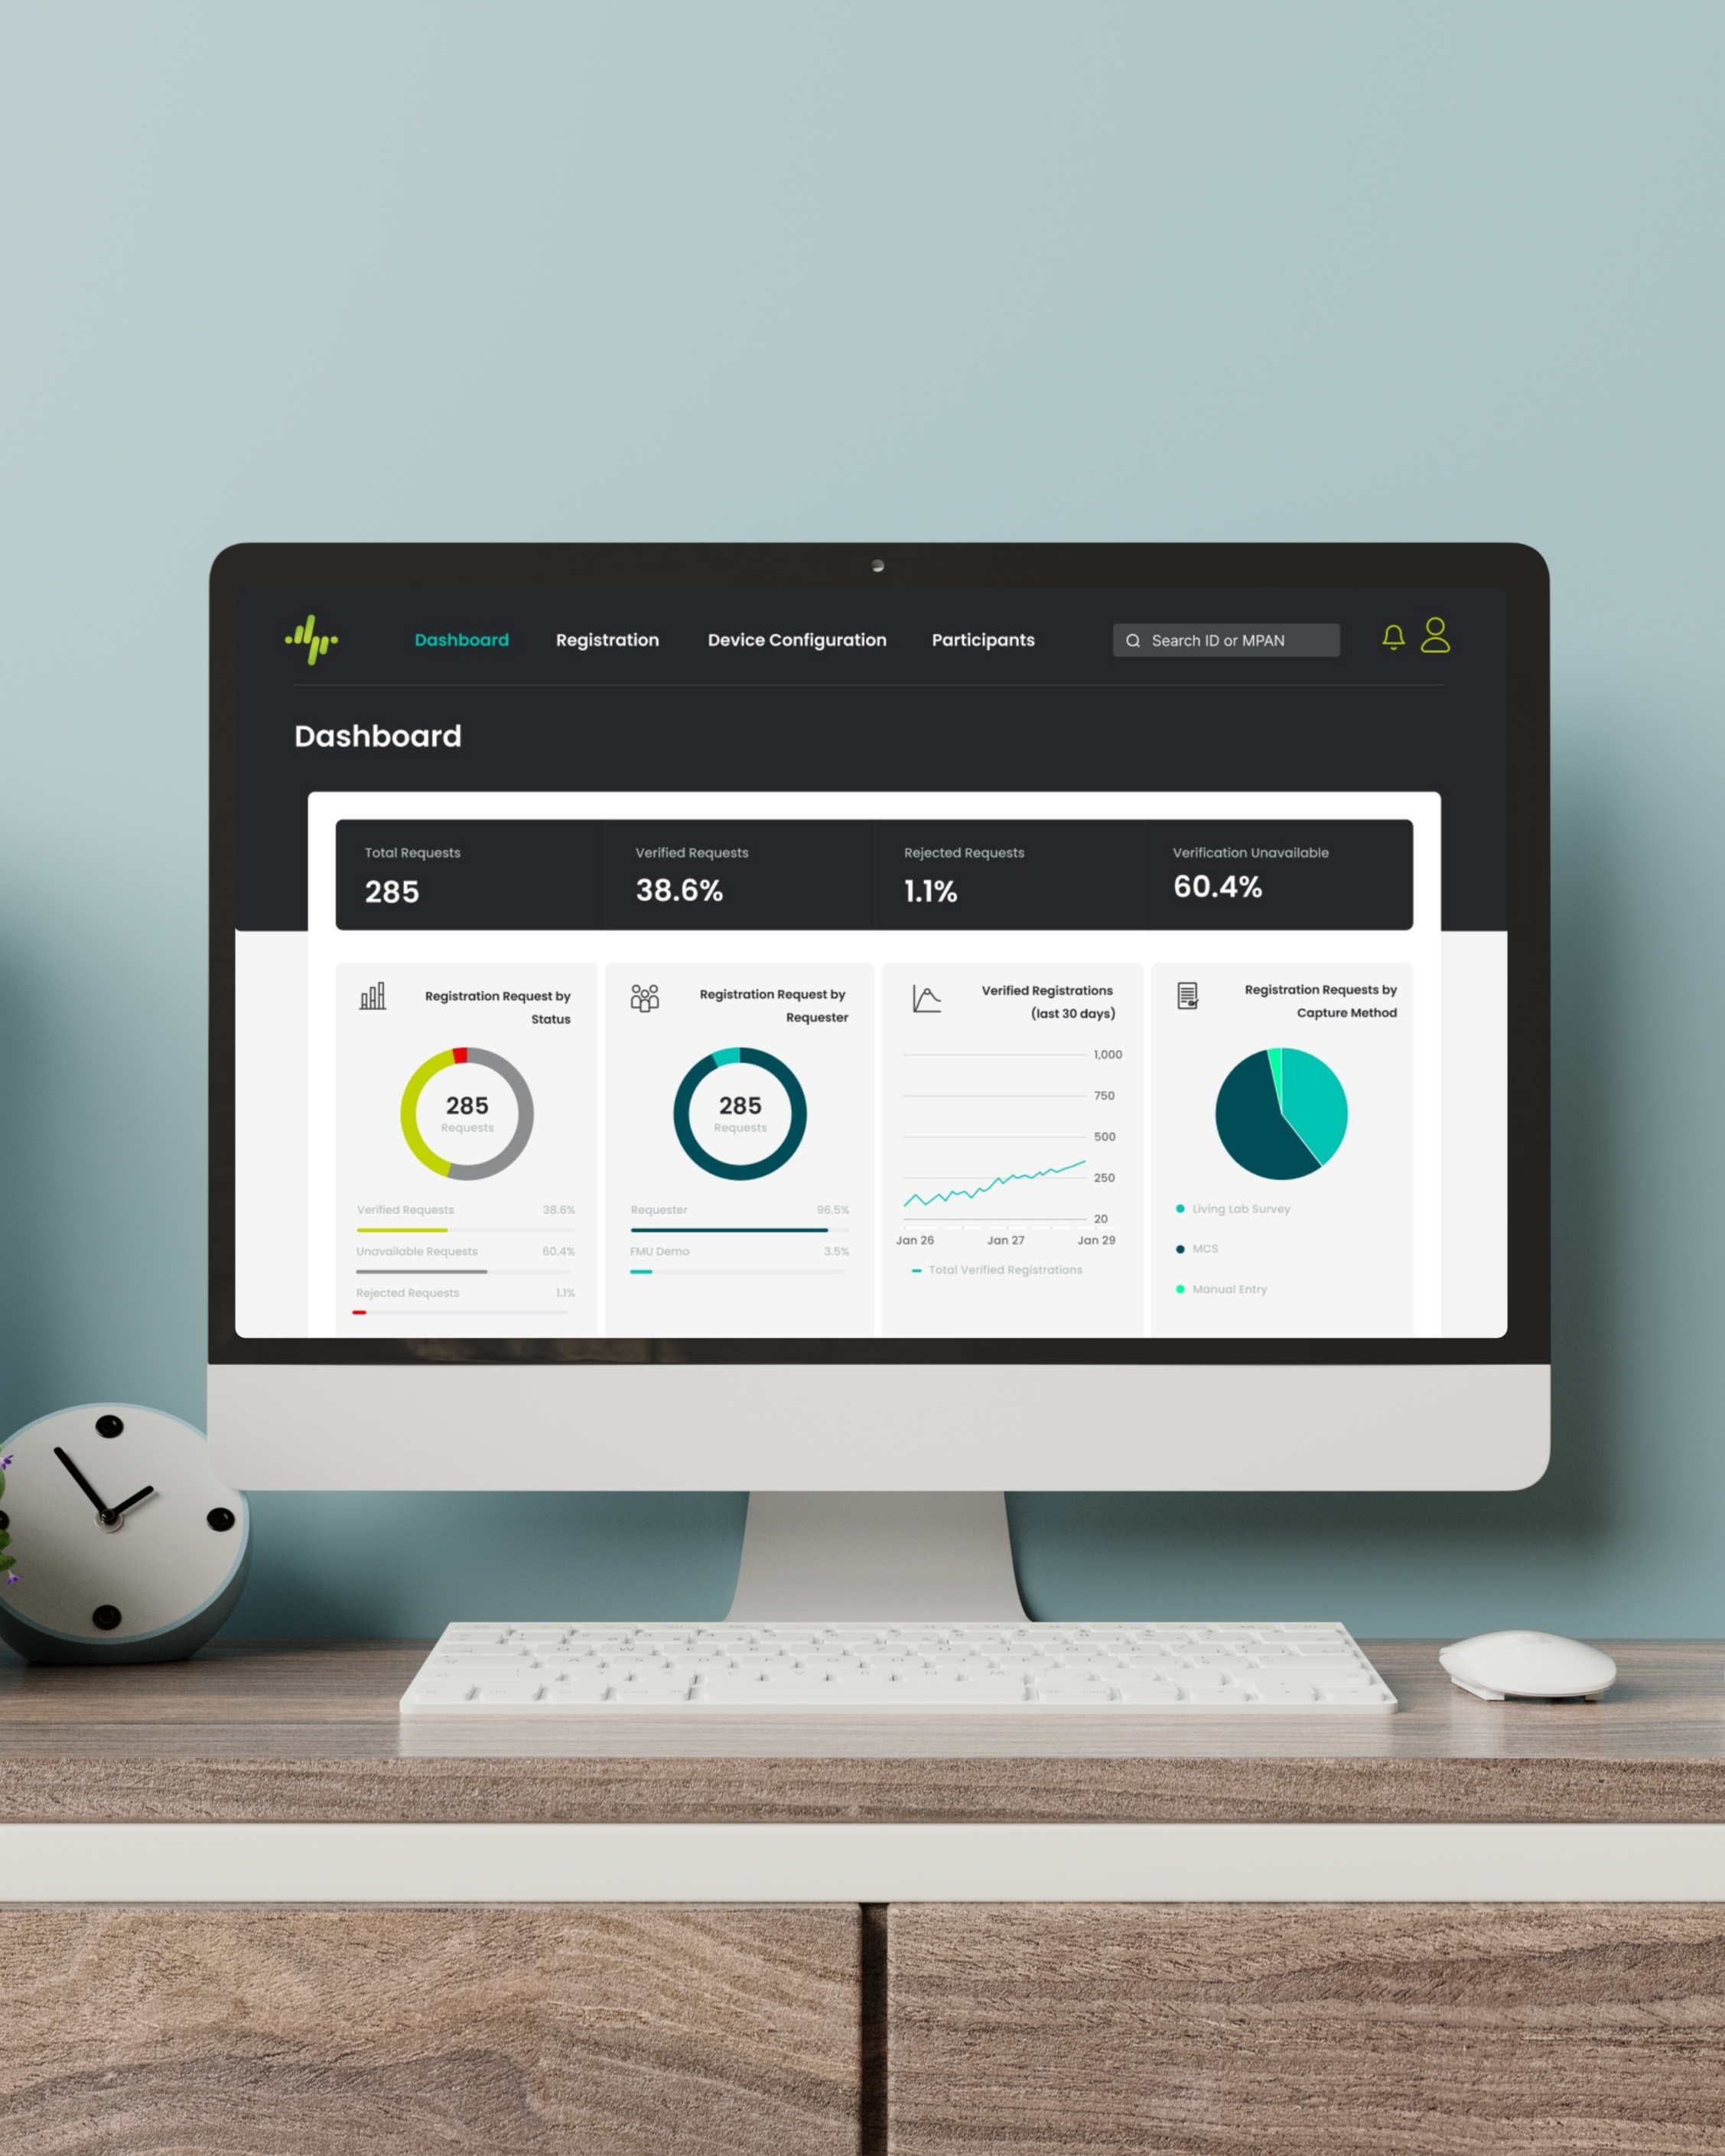
A highly complex and innovative project, designing a user-friendly interface for a brand-new low carbon technology asset register, commissioned by The Department for Energy Security and Net Zero (DESNZ).
The Project
The asset register enables small scale, clean-energy devices, like heat pumps, EV chargers, solar panels, and home batteries, to automatically register and become visible to the electricity grid so the network can be balanced and planned safely.
Roughly 40% of small-scale energy assets were invisible to grid operators. The previous registration process was manual, fragmented, and heavily inconsistent.
The Project Goal
Making asset registration effortless and trustworthy across a diverse chain of users (installers, manufacturers and systems admins).
Collaborating with Developers, translating technical needs into an intuitive experience, reducing users cognitive load. The final product will serve as a crucial tool in advancing the government’s Net Zero initiatives.
Roles
User Interviews
Collaboration with Project
Strategists & DevelopersDesign Wireframing, Prototyping
& Annotations
Tools
Figma
Miro
Google Workspace
Year
2025
Client
Greensync
Investigative Analysis
The UI and back end of the asset register app had already been built by the developers when I came to assist on the project, displaying the data that would be used by operators managing the installed low carbon technology products such as, electric vehicle chargers and solar panels.
A rough UI had been built by the developers, however it was a dense, component driven enterprise UI using Tailwind CSS. It utilised tabbed filtering tables, donut charts for status requests, and complex edge case states, such as bulk CSV upload screens with success/partial-success/failure indicators. The UI had received feedback of being ‘too technical’ and not relatable to all users with visible Raw JSON and confusing search functionality.
Testing the existing User Journey
With the data of the application displayed with some functionality, I extensively tested the existing application and identified usability issues and ideas to ensure its functionality and visual design.
I identified that the page navigation didn’t include all essential page headings.
Inconsistency with button designs.
Inconsistency with call to action names such as ‘delete’ and ‘destroy’.
Branding was inconsistent and unclear.
Unclear call to action buttons, with confusing colour differentiation from other information.
Identify what the Operators will be looking to use the search bar for.
Incorporate Progressive Disclosure in the design, by hiding data that isn’t relevant to everyone using the platform and giving the option to reveal that data to users that its relevant to.
Elevate user trust, treating data integrity as a feature, not an afterthought:
Key UX Journeys & System Architecture
Asset Registration & Validation: A service provider submits a registration (Device type, serial number, and MPAN - the meter point locating it on the grid). The system checks for payload errors, handles data deduplication to ensure data integrity and resolves into clear status pillars (Pending → Verified / Unverified / Rejected).
Privacy & Consent: Features separate opt-in paths for registration versus live data streaming. The asset register handles three distinct levels of system exit: Revoke (hide data), De-register (remove from grid) and Purge (GDPR-grade "right to be forgotten" erasure).
The Admin Interface: Th original UI utilizes tabbed filtering tables, donut charts for status requests, and complex edge case states, such as bulk CSV upload screens with success/partial-success/failure indicators.
User Interviews
I interviewed the Installers, Manufacturers and Systems Administrators that would be using the asset register to use the current asset register for their own specific roles. I gathered insights through usability testing, listening to their frustrations and observing their mental models. Users echoed the similar issues that I identified during testing;
They found the page navigation headings misleading and didn’t show the data that they expected upon clicking on the heading.
Users found the terms ‘delete’ and ‘destroy’ very confusing, did they mean the same thing or something completely different?
Page navigation headings could be more concise, they would expect to find ‘De-registration requests as a subsection under ‘Registration Requests’.
The use of green to highlight some words and call to action buttons was confusing for users. Unclear call to action buttons, with no use of buttons or highlights to differentiate from other information.
The visible Raw JSON appeared jarring and not relevant to all users, causing cognitive overload.
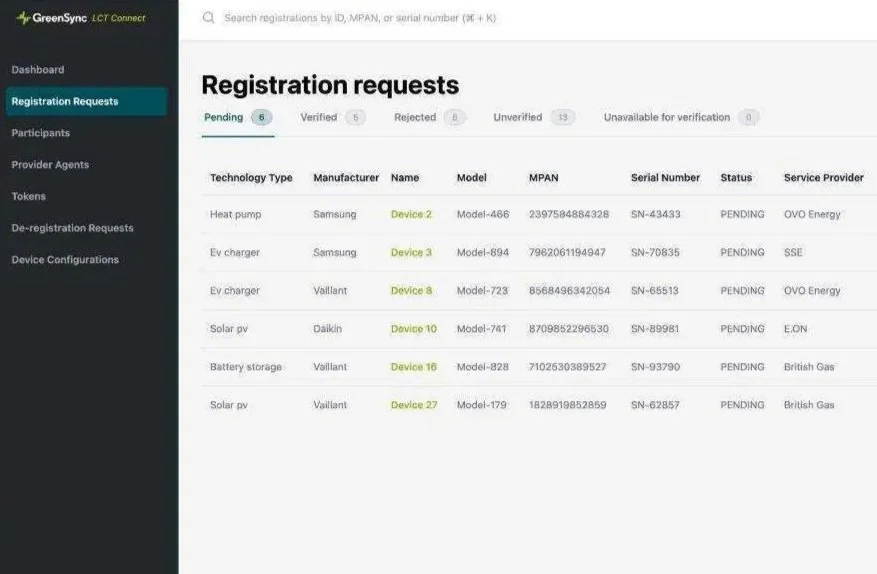
Page Navigation - unnecessary and unclear headings that can be organised in to subsections.
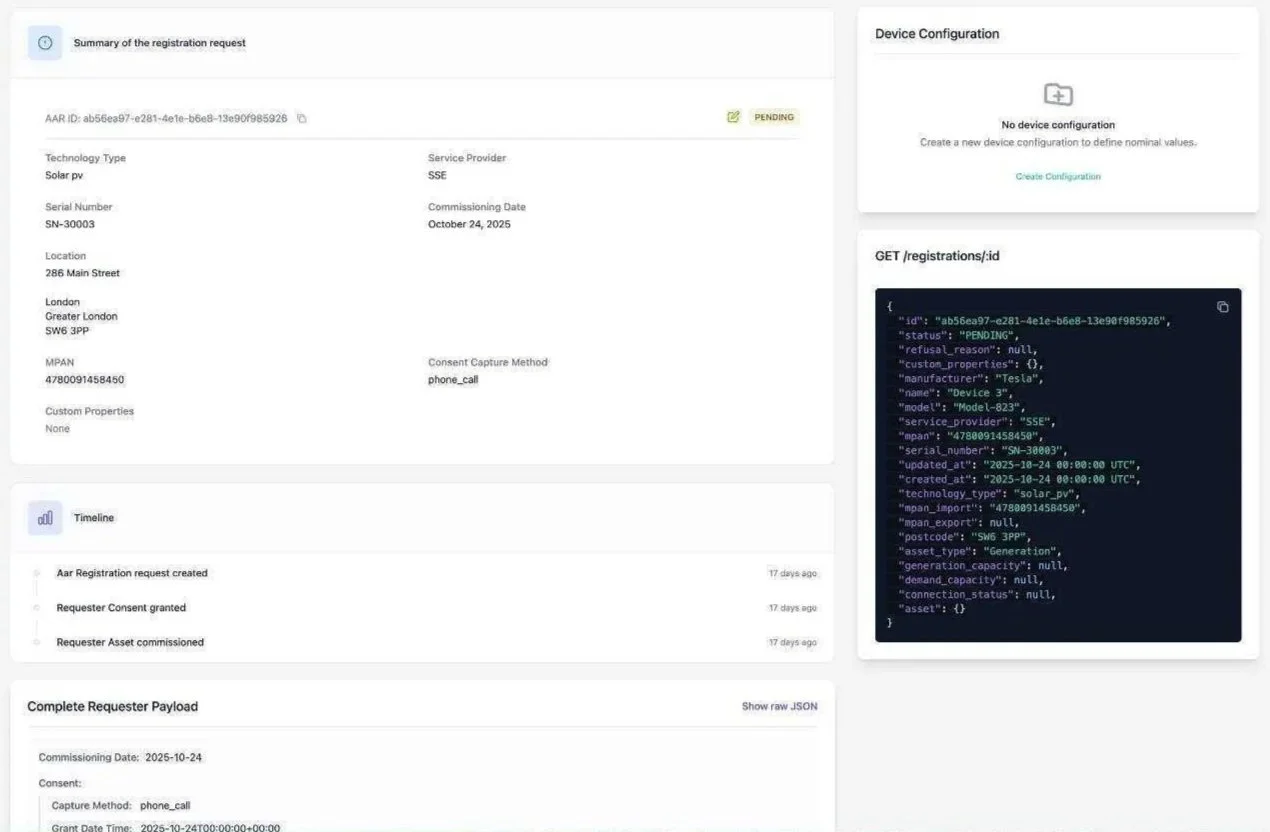
Inconsistency with button designs and colours. (Some bright blue and some bright green). Causing user confusion. Raw JSON being visible caused further cognitive overload.
User Feedback
Following my interviews with the users, they provided some excellent insight in to the key functionality and features that they would find useful from the application.
Operator login functionality.
Dashboard showing core KPI’S, with an indication of urgency.
Ticketing System to register existing and new assets. With the functionality to track their own and colleagues actions and tasks.
Track new participants (third party asset providers).
Discount Token System for new participants upon registration.
Identify missing data and incorrect data with prompts to Operators to gather and input missing information.
Identify New Device configurations and identify the product that has been installed.
Functionality to authenticate tokens for new participants.
Be able to see how many participants want access to the Asset Register.
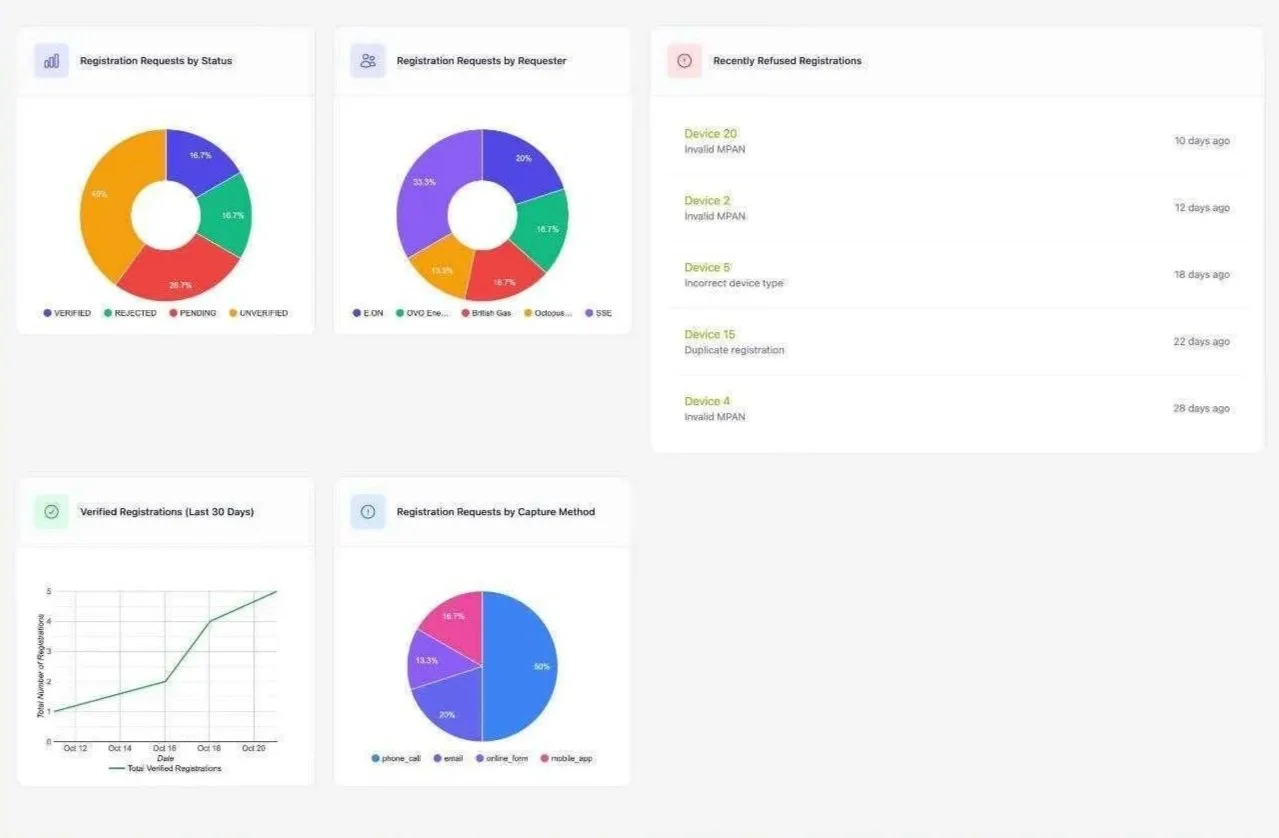
Brand inconsistency through colours and icons.
Features
During meetings with the Head of Product, Developers and Systems Administrators, we identified features that would be useful and effective for the user navigation. These included;
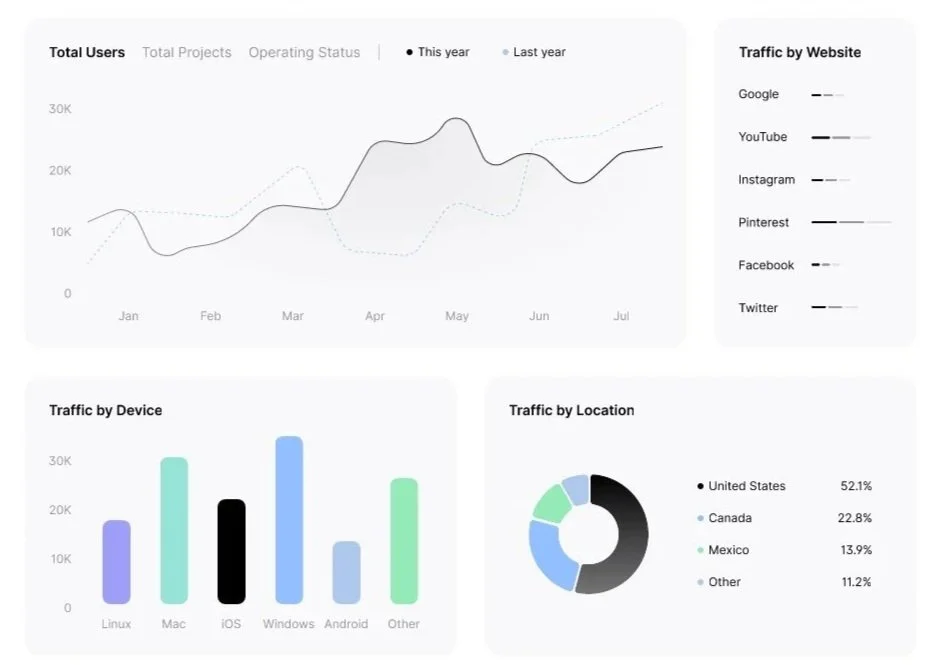
Dashboard to view statistics, to view the registration requests (new product installation requests) to identify which have been verified, rejected, and unavailable for verification.
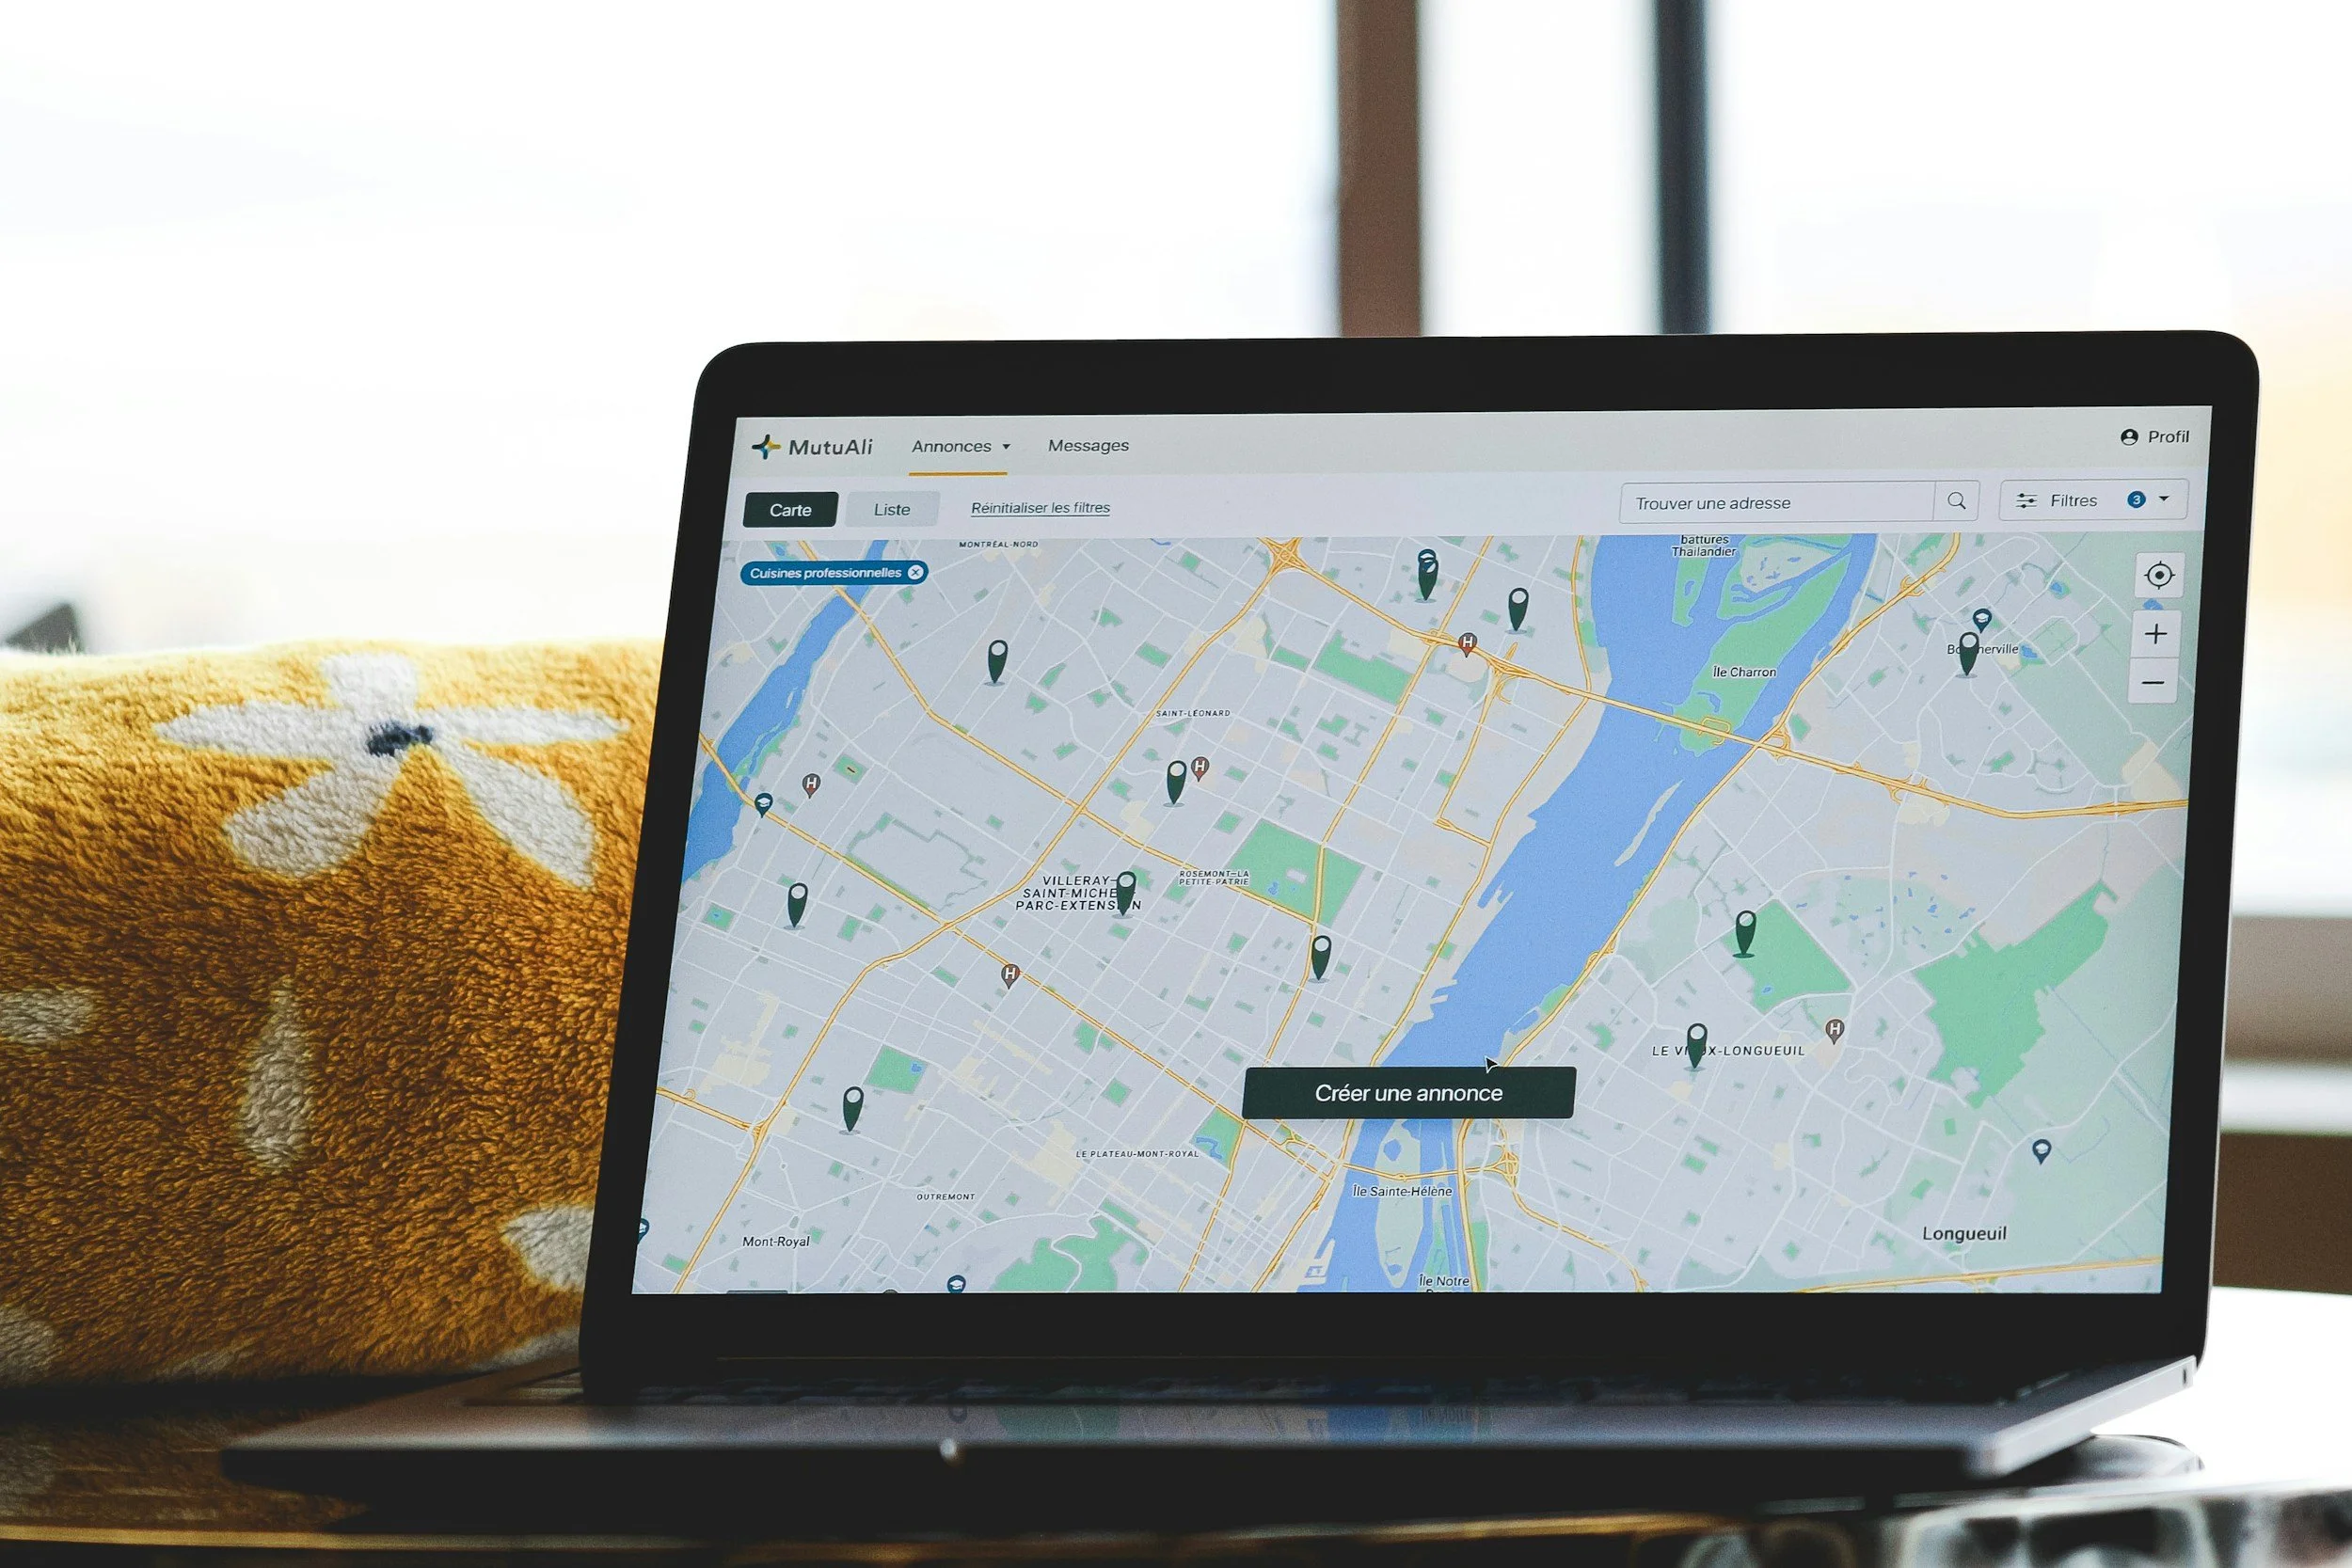
Map to locate where the low carbon technology products are located and to see which UK regions have dominant coverage.
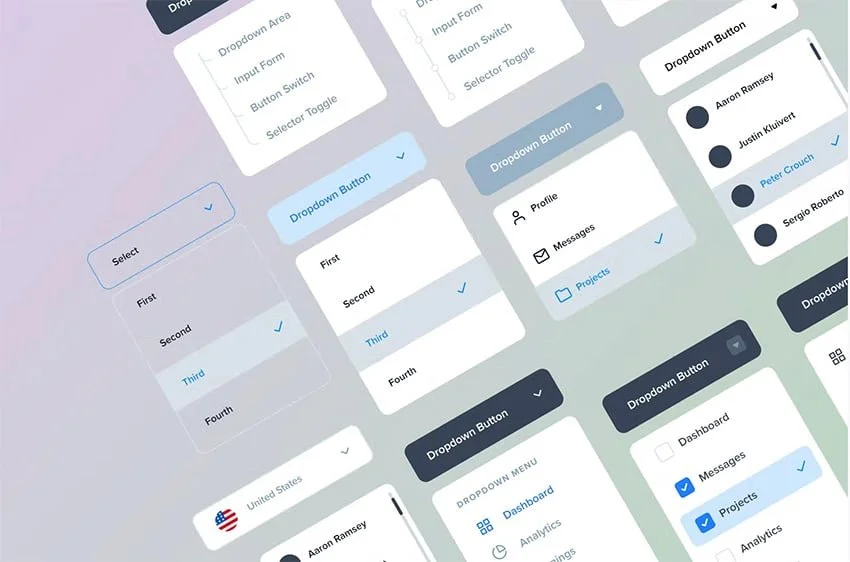
Drop down menu to consolidate Participants ‘Third party asset providers’ and discount tokens they have achieved.
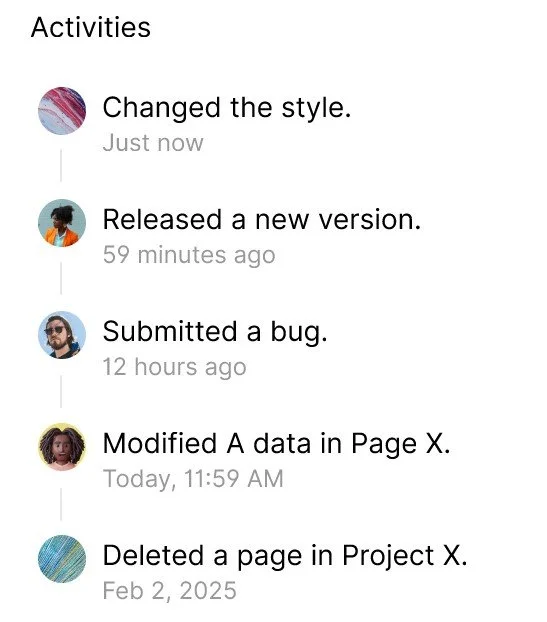
Activity feed for updates, notifications and operator activity logs in chronological format.
Design Solutions
Greensync Brand Kit
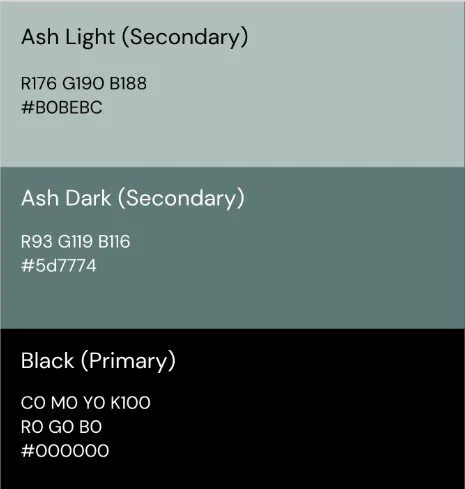
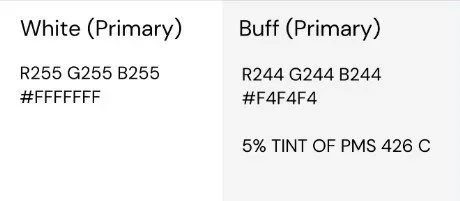
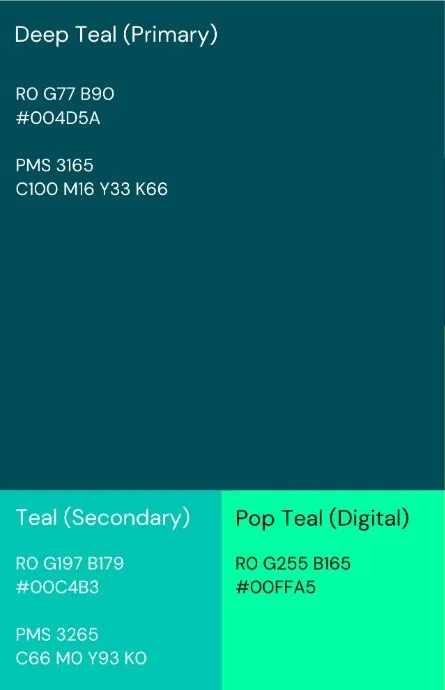
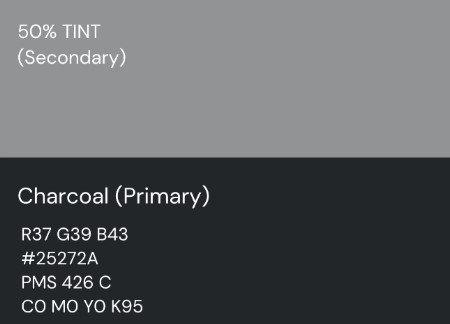
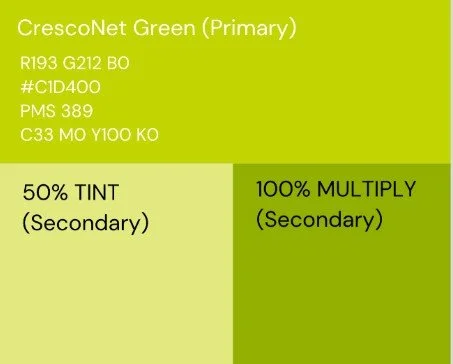
Brand Colours
Brand Icons






Brand Logos















Design Solution
Visual Identity
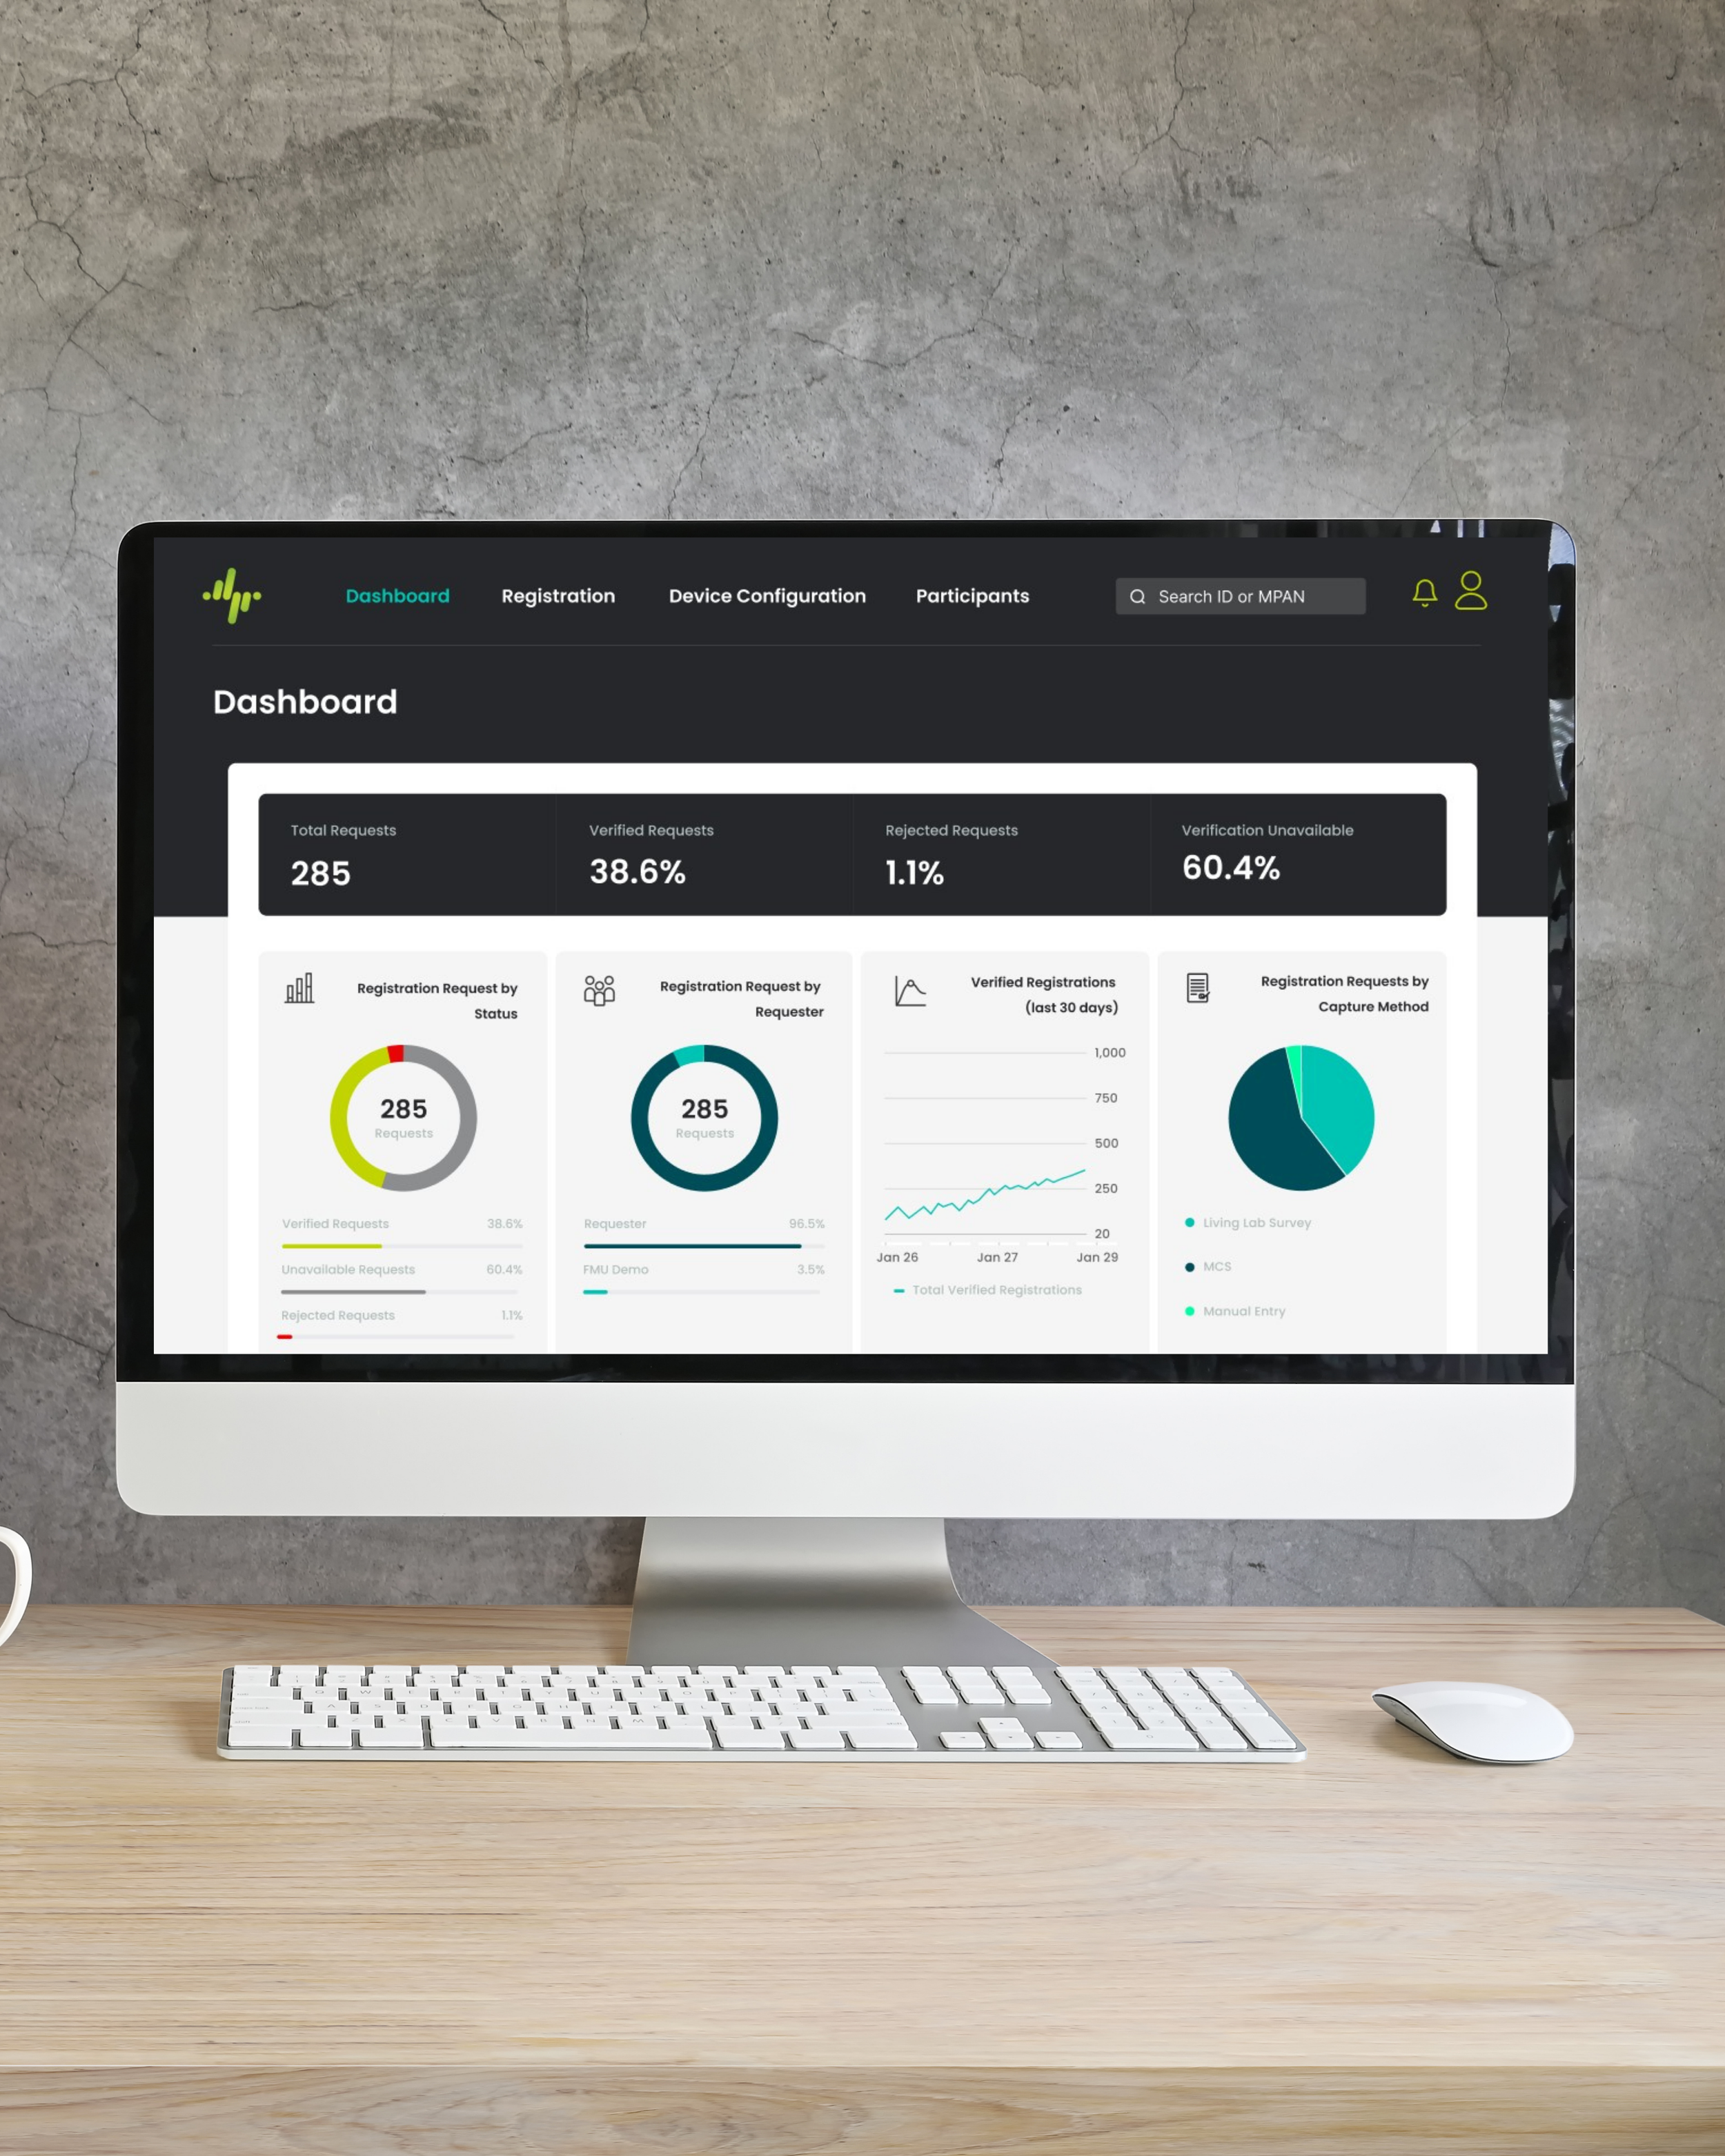
Brand Identity The original design used a standard "enterprise" palette of dark blues, greys, and yellows for status indicators. I incorporated the greensync brand kit across the whole of the UI, introducing the vibrant high-contrast lime green and teal palette against a deep charcoal background, giving it a much more energetic, "Clean Tech" brand identity.
Typography I updated the typography throughout the design, using a modern, rounded geometric sans-serif, which feels friendlier and more professional than the standard system fonts used in the original.
Search Functionality I moved the search bar from a centered, understated position to the top-right, following common UI patterns for modern web apps, making navigation familiar to the user.
Spacing & Icons I used a dark header with white content cards, reducing the number of small interface elements, reducing visual noise, creating stronger contrast and a more premium feel. I incorporated icons from the brand kit, making the design look less utilitarian and more finished.
Design Solution
Dashboard
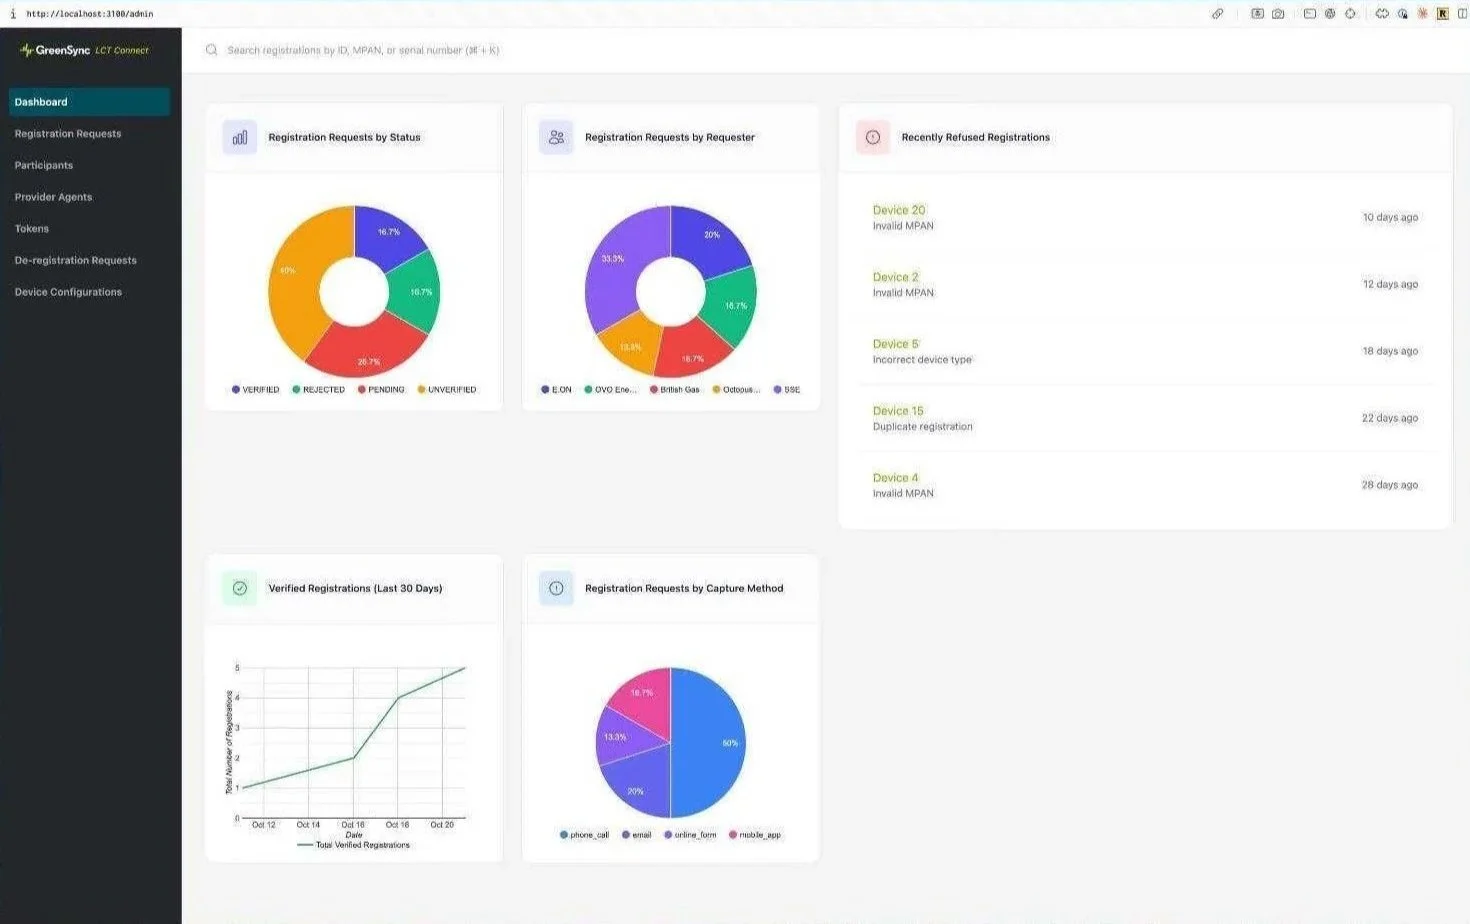
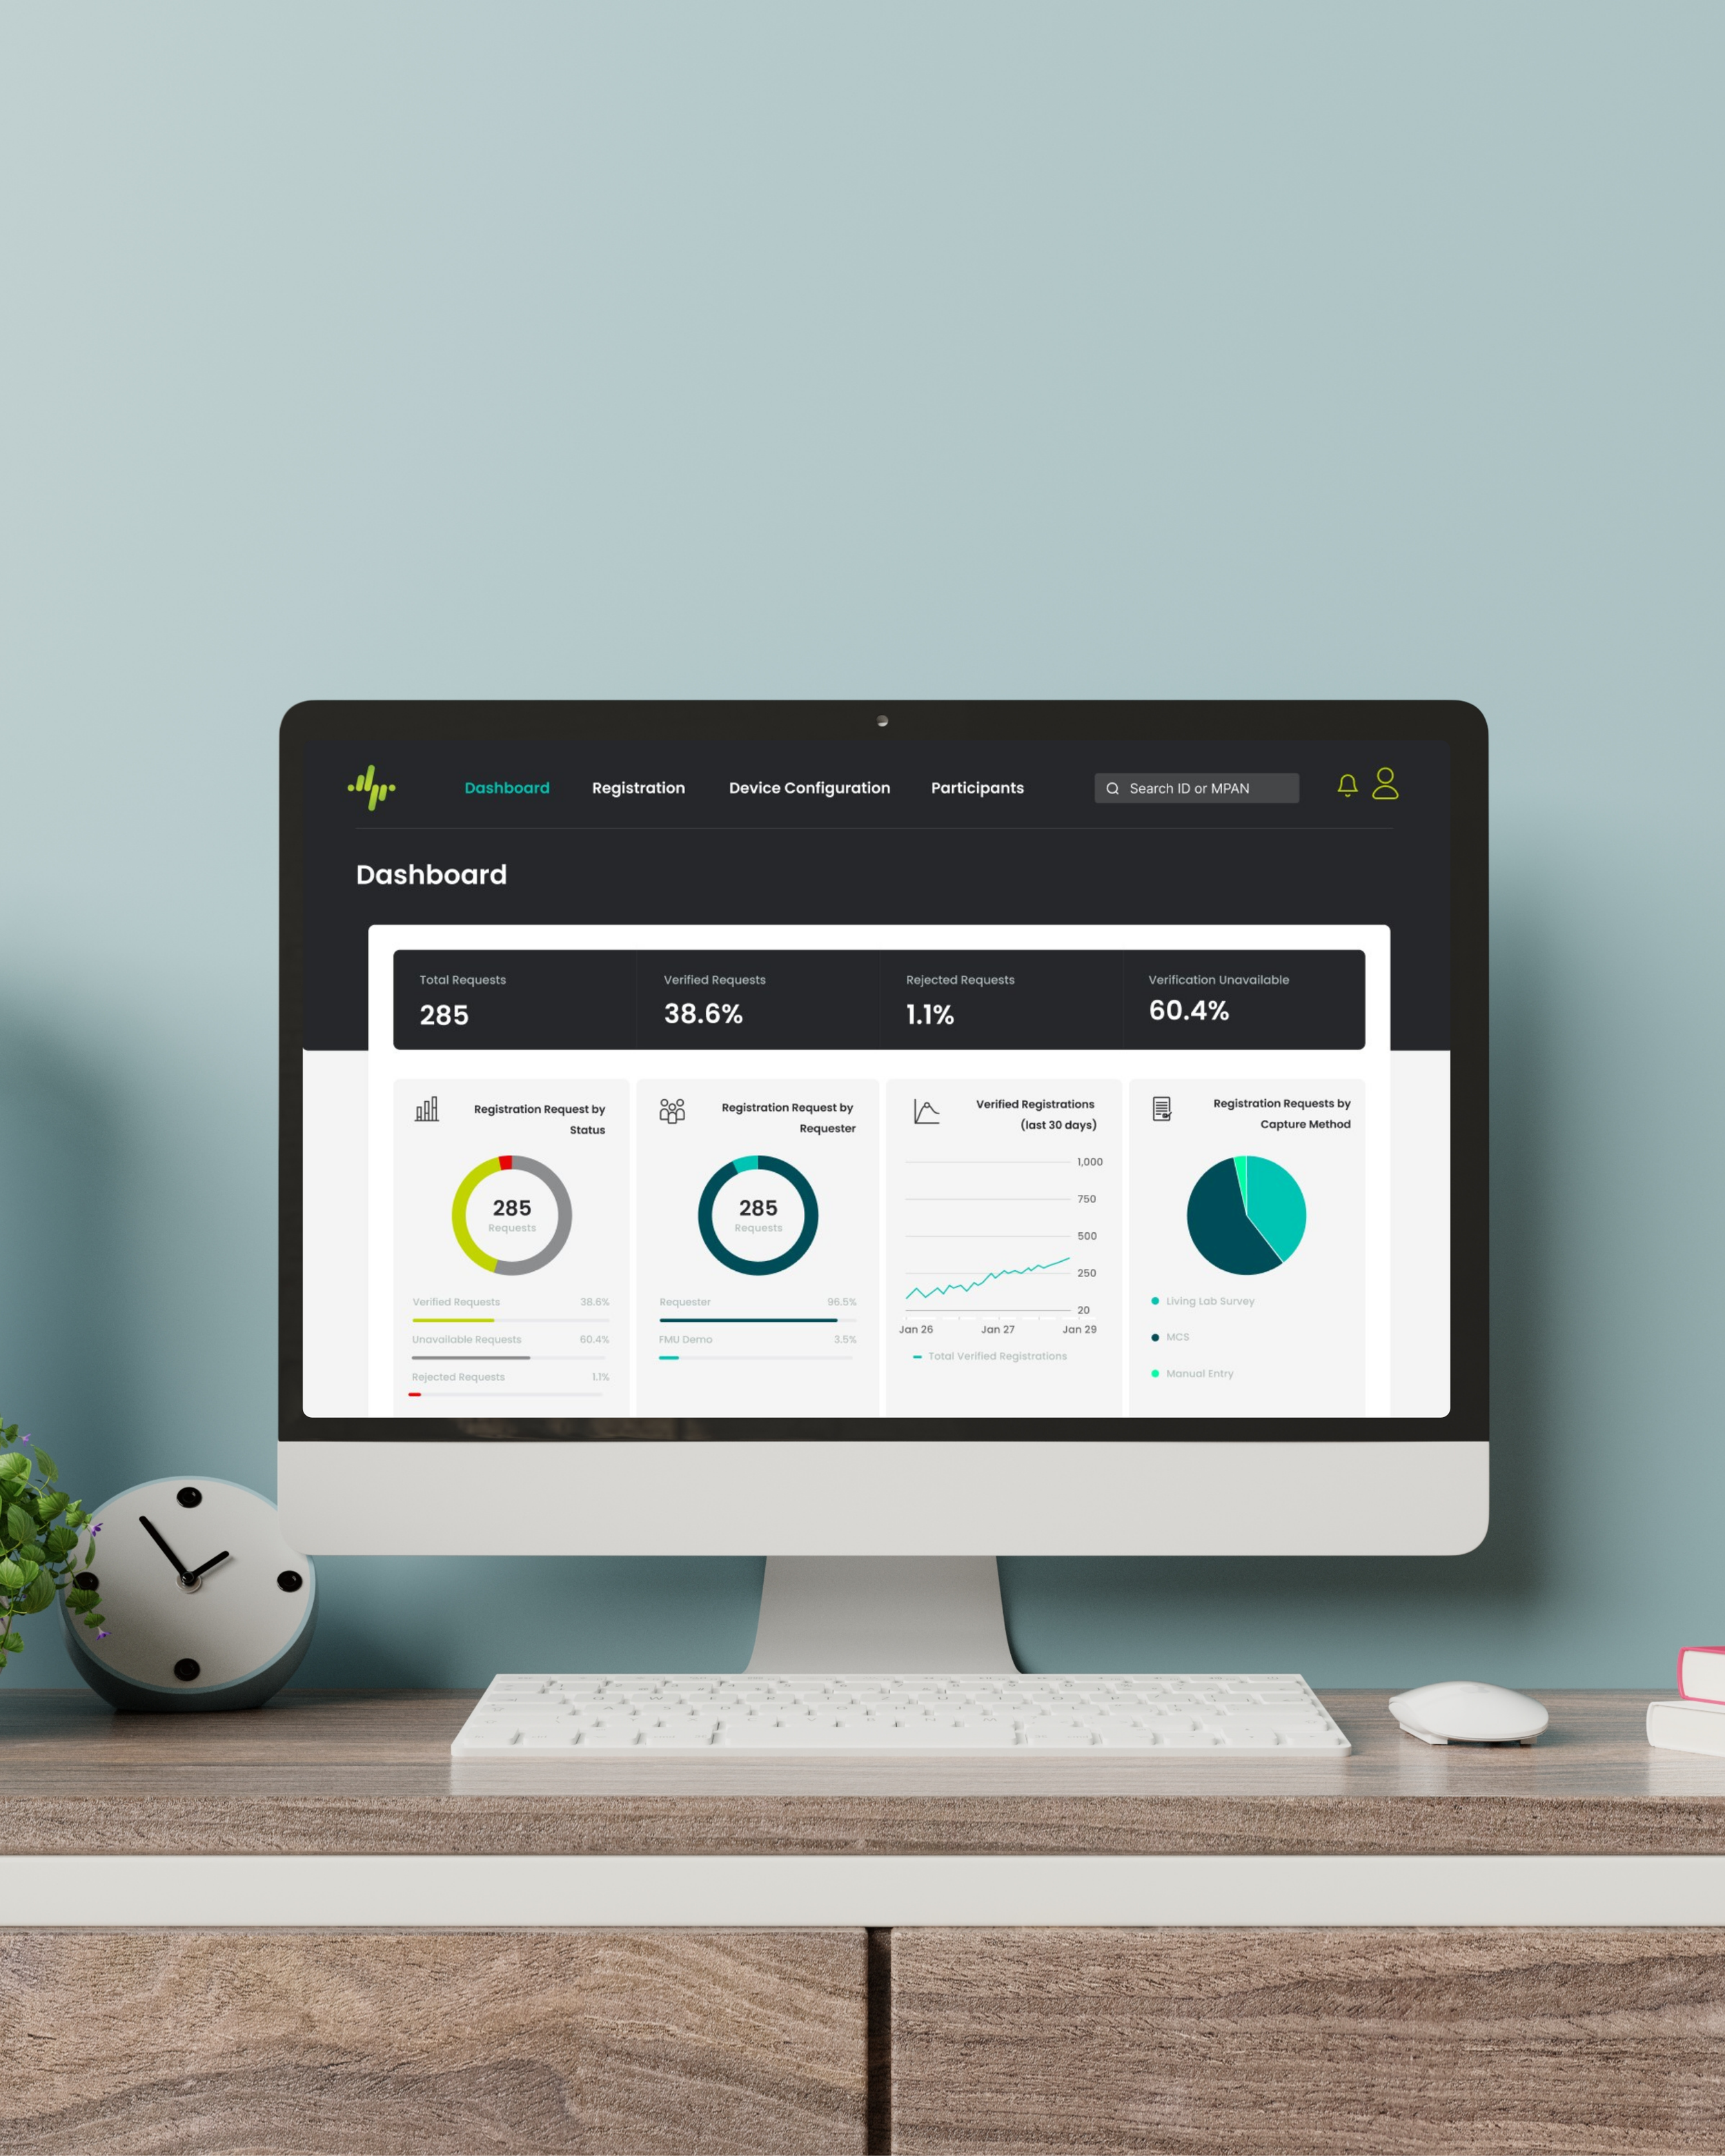
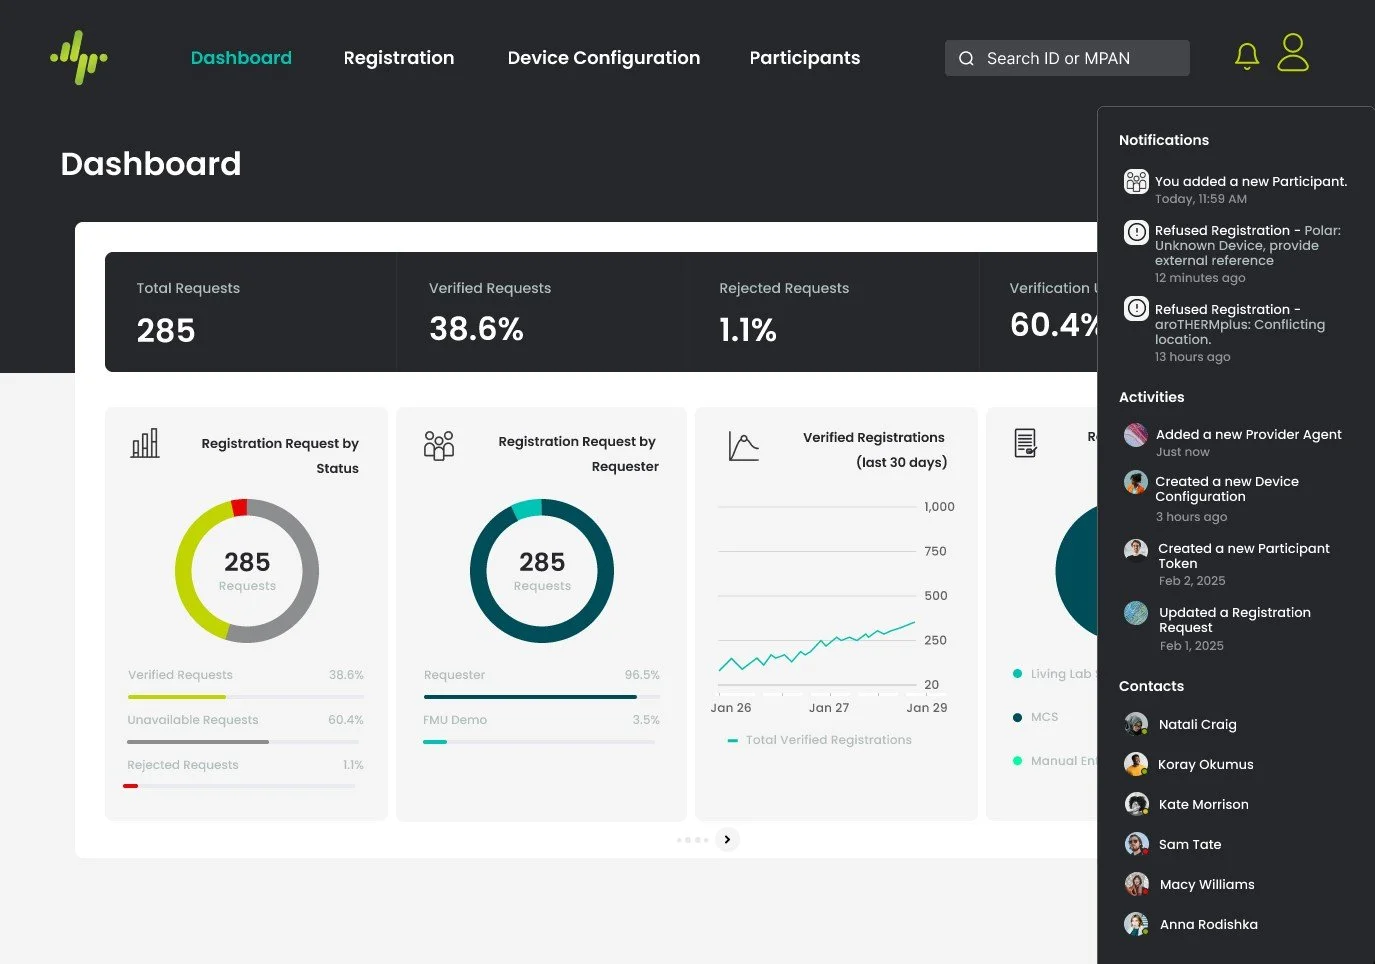
I redesigned the dashboard from an admin UI into a cleaner, more polished product interface with stronger hierarchy, better spacing, and a more modern visual style. The biggest changes are in navigation, card layout, chart presentation, and overall branding.
Before
After
The navigation moved from a dark left sidebar to a top navigation bar, making the new design feel less like an internal admin tool and more like a consumer-facing web app.
The branding was simplified. The first design uses “GreenSync LCT Connect” with a sidebar-heavy structure, while my redesign uses a more minimal logo and a broader top header.
The content layout became more structured. In the original design, the dashboard was split into many uneven cards and panels, I reorganised the information into a clearer grid with consistent spacing.
Information hierarchy was adapted to summarise KPI’s, making the key metrics easier to scan quickly before looking at the data charts below, allowing the dashboard to read in a more logical flow.
I Designed custom data tables/dashboards that remained clean and accessible, ensuring that users could interpret complex data points in seconds without making errors.
My design uses larger spacing and clearer card boundaries, improving readability.
Users requested an Activity feed for updates, notifications and operator activity logs in chronological format with the functionality to track their own and colleagues actions and tasks.
I designed a notification bar displaying the users and their colleagues recent changes along with refused and accepted registrations, creating a sense of urgency and guidance to address what tasks needed their attention. Users can also view and get in touch with colleagues that are actively online.
Overall, the Dashboard redesign replaced ambiguous navigation and inconsistent labeling with a clearer hierarchy, cleaner grouping, and better visual cues. Making the user experience easier to understand and the navigation inline with user expectations, addressing users original frustrations with each page heading not showing the data that they expected upon clicking.
The redesign appears more polished and contemporary, with a stronger design system and better use of visual hierarchy, improving how users move between list, detail, and configuration states, rather than forcing everything into one crowded table. The spacing and for admin tools because it reduces cognitive load and makes frequent tasks feel more efficient.
Design Solution
Registrations
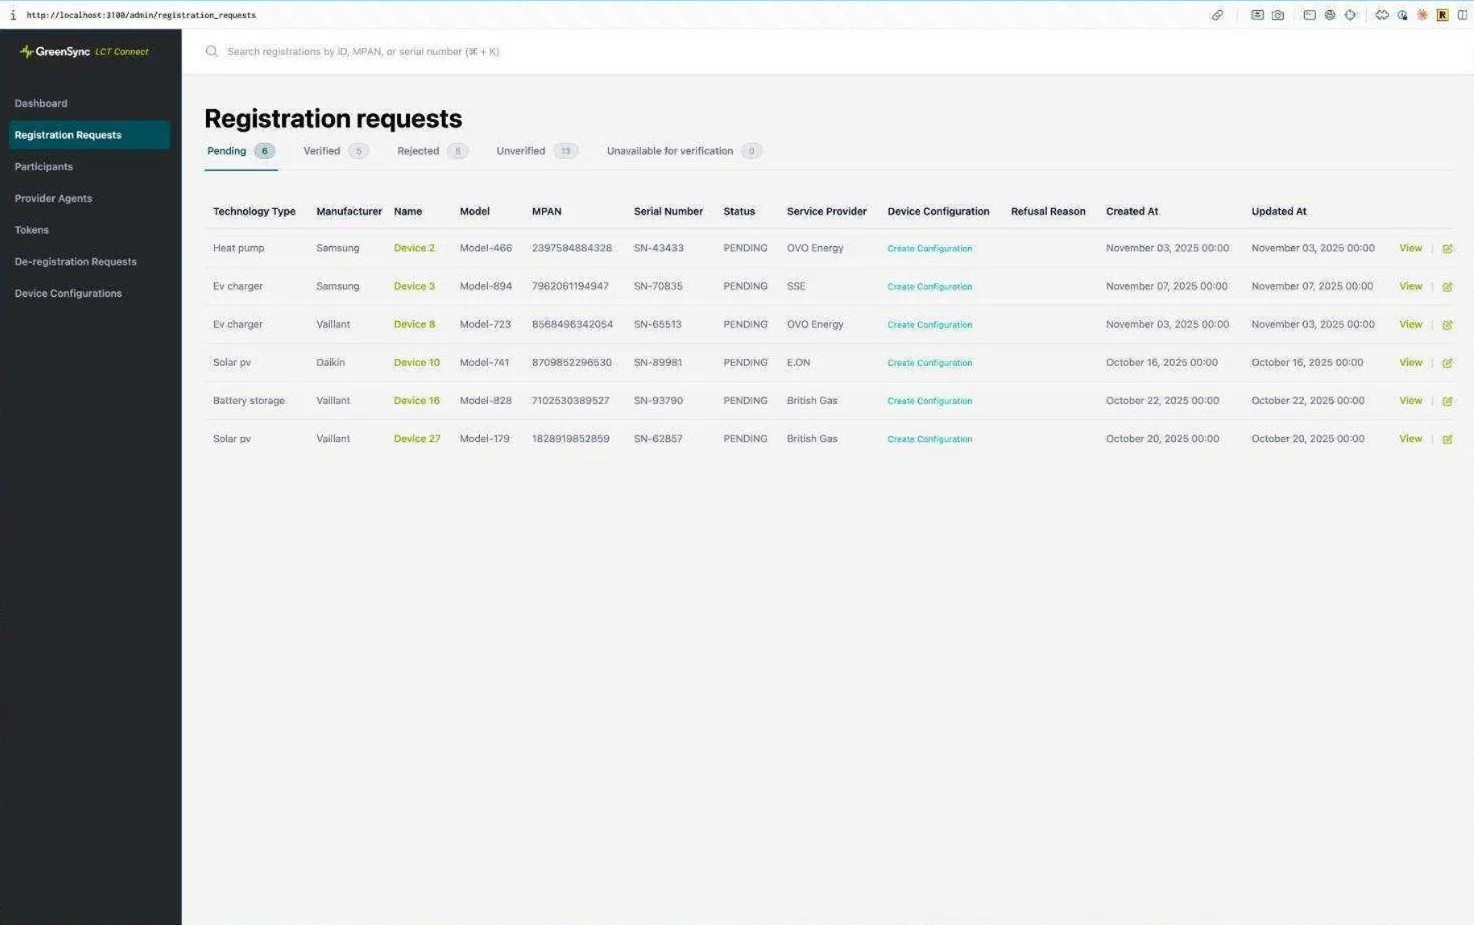
I Redesigned a dense registration management table into a cleaner, more intuitive workflow, improving hierarchy, scanability, and action clarity.
Before
After
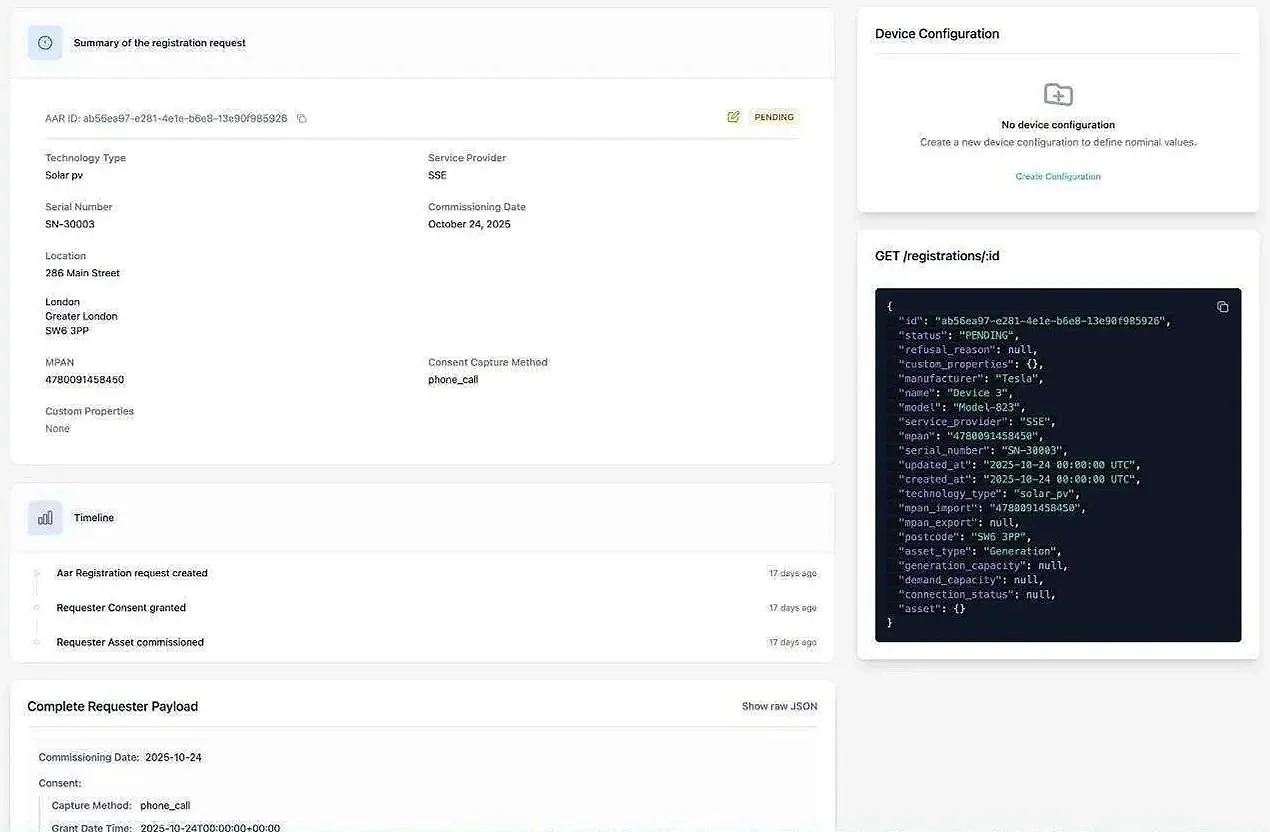
Feedback was given that the redesign significantly lowered the "cognitive load" for the user by stripping away technical metadata (like the JSON block) and focusing on high-level management tasks.
The original design appeared as a dense admin table with many visible columns at once, I created highlighted tabs, with call to action colours that clearly displayed the registration requests that required attention.
Through further discussion with the development team and users, we included an AI search functionality, allowing users to select a single method of searching through the registrations and intuitive suggestions through AI, to see how else they may want to filter their search through registrations.
I improved visual hierarchy by categorising all registrations under the same page. Originally registration and de-registration were two completely separate pages. Making user navigation more concise and fulfilling user expectations.
Users felt confused by the use of call to action colours, I made these clear and consistent throughout the design providing a cleaner more guided workflow for reviewing requests.
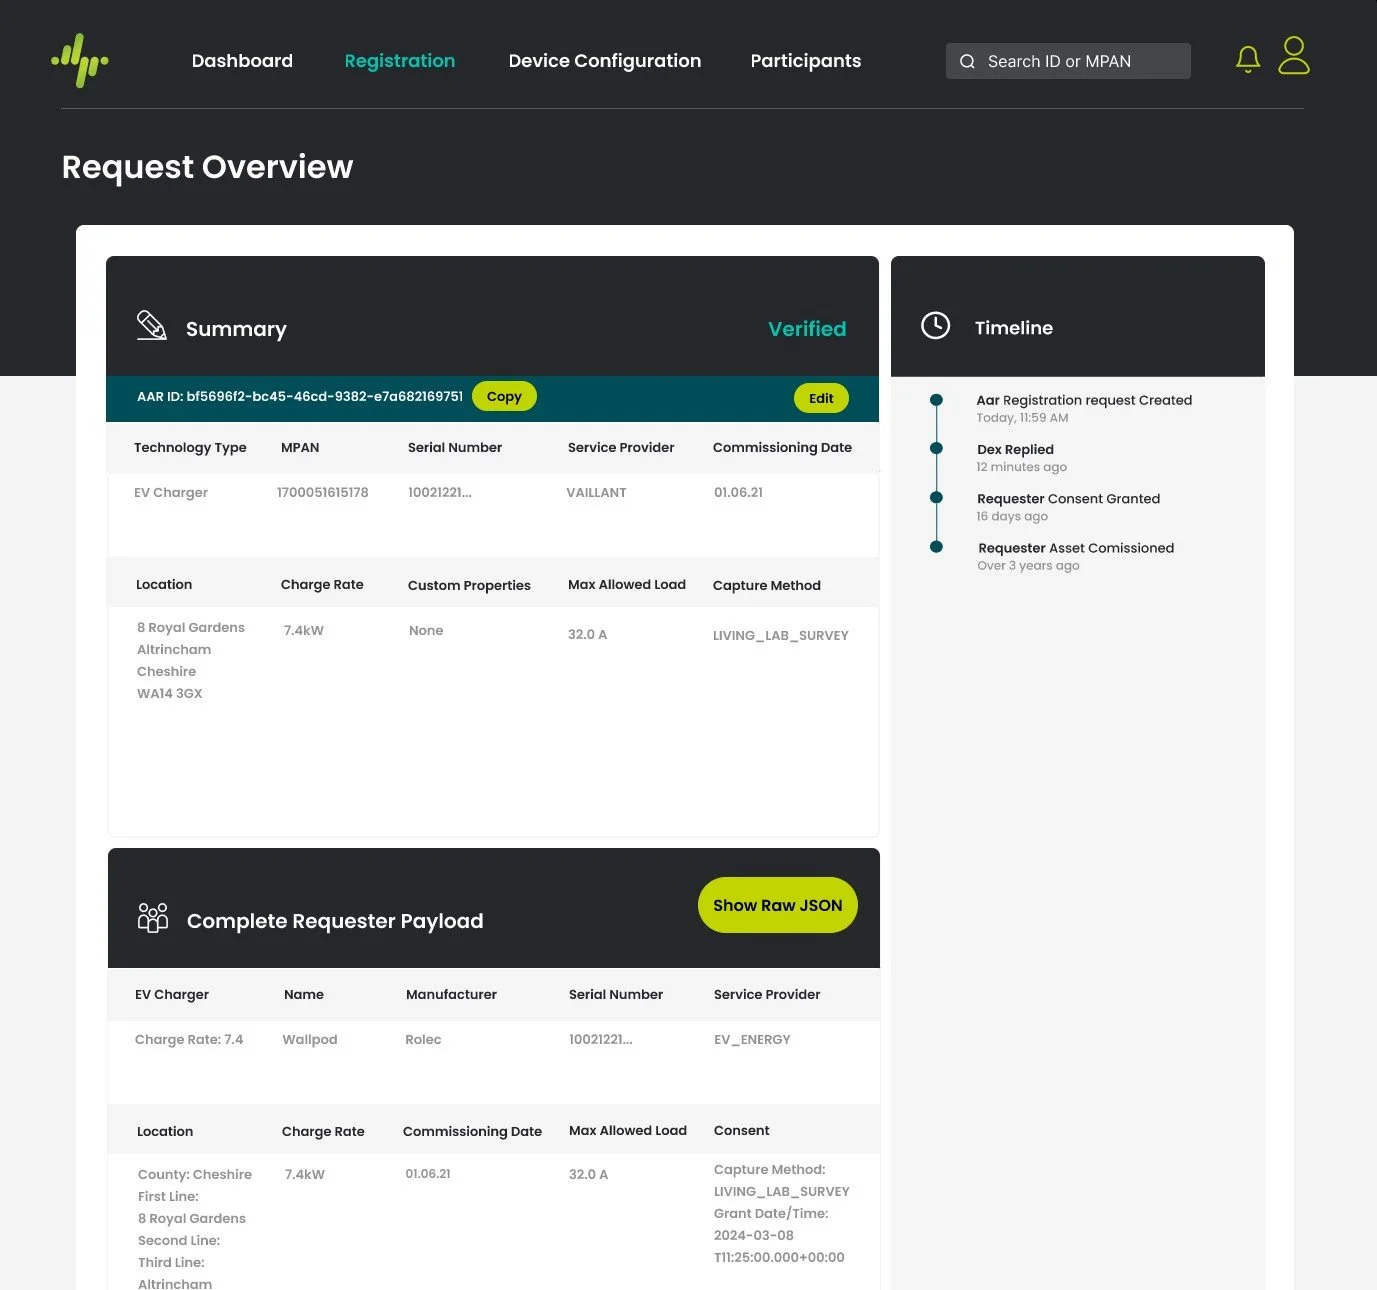
I improved the visual hierarchy by finding out the key information that users would immediately need to see when navigated to the page. I created a filter to search through the registrations by user relevance. I also improved visual clutter by truncating long numbers such as the MPAN and Serial Number.
I designed scannable status pillars to summarise large data pools into clean top level metric blocks (Total Requests, Verified, Rejected, Verification Unavailable), you allow an operator to evaluate the whole system health quickly.
I used progressive disclosure when clicking a row in the Registration table, instead of overloading the user with large amounts of data, I cleanly route them to a detailed Request Overview page. The layout organises data chunk by chunk; Summary cards, Location profiles, the complete technical Request Payload and an isolated panel for Device Configuration, making actions feel intentional and easier to access and digest.
I added micro interactions, including a one-click "Copy AAR ID" button next to complex data strings, saving system operators user frustration.
Designing for a multi-stakeholder system, I made the Code Legible, by incorporating a "Show Raw JSON" interaction, serving the users who need schema-level details while keeping the main interface clean, scannable, and readable for other users.
The new design transforms a crowded registration table into a more intuitive admin workflow, improving clarity, interaction quality, and overall usability.
Design Solution
Device Configuration
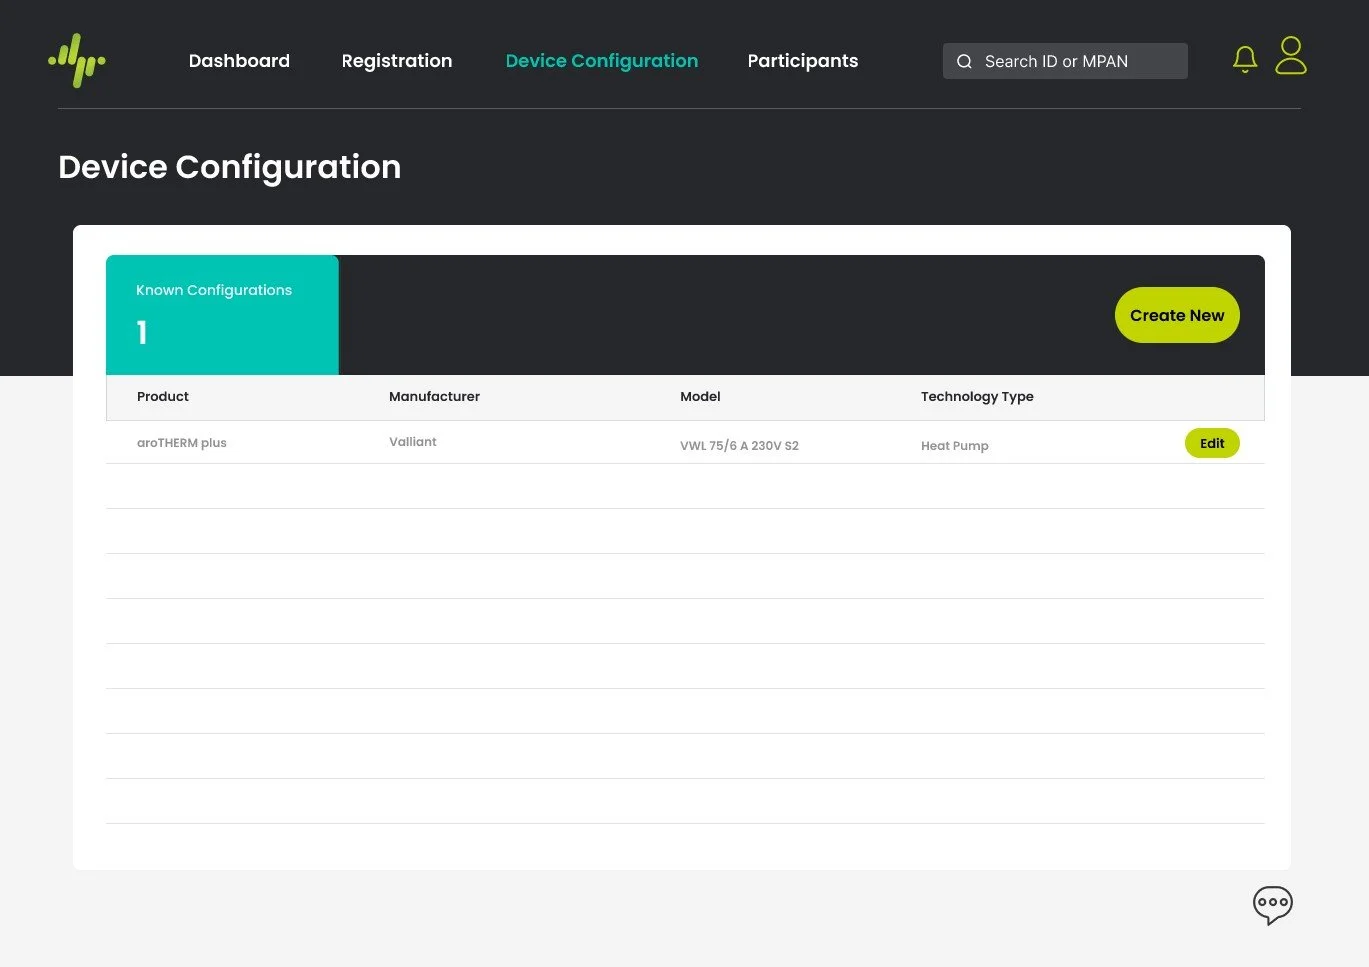
Information Hierarchy: The Device configuration page was of high importance and a page commonly used by the users. Originally device configurations were listed at the bottom of the navigation bar. I moved it to the third page to be selected on the navigation bar, along with its own dedicated page to manage and create new Device configurations all within its own categorised page.
Actionable Elements (Buttons): Users were confused by the use of colour in the orginal design, unsure of what information was an action button or not. I created prominent pill shaped, brightly coloured buttons in the redesign (e.g., "Create New") to clearly signal the "Primary Action" for the user.
Status & Feedback: Users requested clearly presented KPI’s to create a sense of urgency when looking at Device Configurations. I created a "Known Configurations" counter which provides an immediate summary of the system state, compared to the original design requiring reading through a list or JSON payload to understand the configuration status.
Content Grouping: the original design used multiple "cards" and nested JSON snippets, which felt overwhelming and clunky to users. The redesign uses a single, clean centralised container with large, clear headings.
Before
After
Design Solution
Participants
System Administration Users wished to track new participants (third party asset providers) and have a discount Token System for new participants upon registration.
Originally the ‘participants’ and tokens pages were not categorised together or displayed next to one another in the original navigation bar. I created a tab under participants for Tokens to be accessed easily by the user, seen as tokens would only ever be used when navigating to view or update the participants.
I created an individual truncated discount token code that could be copied and sent on to new participants, along with the ability to deactivate the code.
I updated all the call to action buttons, reducing the ambiguity that users felt with the original design upon making new changes.
Complete
Design Solution
Prototype
Testimonials
“ I had the pleasure of working with Rebecca on a highly complex and innovative project—the design of a user-friendly interface for a brand-new low carbon technology asset register, commissioned by the Department for Energy Security and Net Zero (DESNZ).
Rebecca took on the challenge with great expertise, crafting a visually appealing and highly functional User Interface that not only met all our requirements but also excited the final customer. Her ability to translate technical needs into an intuitive experience was invaluable.
The final product exceeded our expectations, and we’re confident it will serve as a crucial tool in advancing the government’s initiatives. I highly recommend her work!."
— Igor Dremelj, Corporate Business Strategy / Digital Business Transformation